Netsuite Application Performance Management (APM) SuiteApp
What is APM
The Application Performance Management (APM) SuiteApp enables you to see and manage the performance of your NetSuite customizations and business critical operations. You can use the dashboard, data visualizations, page time summary, script analysis, and script queue monitor to review and improve the speed of the NetSuite UI.
Features and Benefits
The Application Performance Management (APM) SuiteApp is designed to help you to:
- Identify performance opportunities or degradation. Prioritize issues based on usage and traffic.
- View performance metrics for your most important record pages and assess system health and trends.
- Drill down for greater levels of detail about specific record types, operations, and instances.
- View response times by client, server, and network.
- Monitor performance of user event scripts, workflows, RESTlets, scheduled scripts, and Suitelets.
- Check the overall health of jobs handled by SuiteCloud Processors, scheduling queues, or both.
- Export performance data captured on its various pages
- Available for installation at no cost.
What challenges does it solve
- Can determine which script or workflow is causing a high SuiteScript or workflow time.
- APM gets data from a date prior to the date this SuiteApp was installed identifying pre-existing performance issues apart from monitoring.
- Reads from data stored in the back end. It does not create any additional overhead for your existing customizations aside from the scripts used to display the dashboard.
- Distinguish client side issues like browser settings etc from Server Issues.
- Lets you gather performance data about the timing and context of an operation, action, or request. You can use this tool to determine which operations cause delays.
AVT APM Tool Screenshots
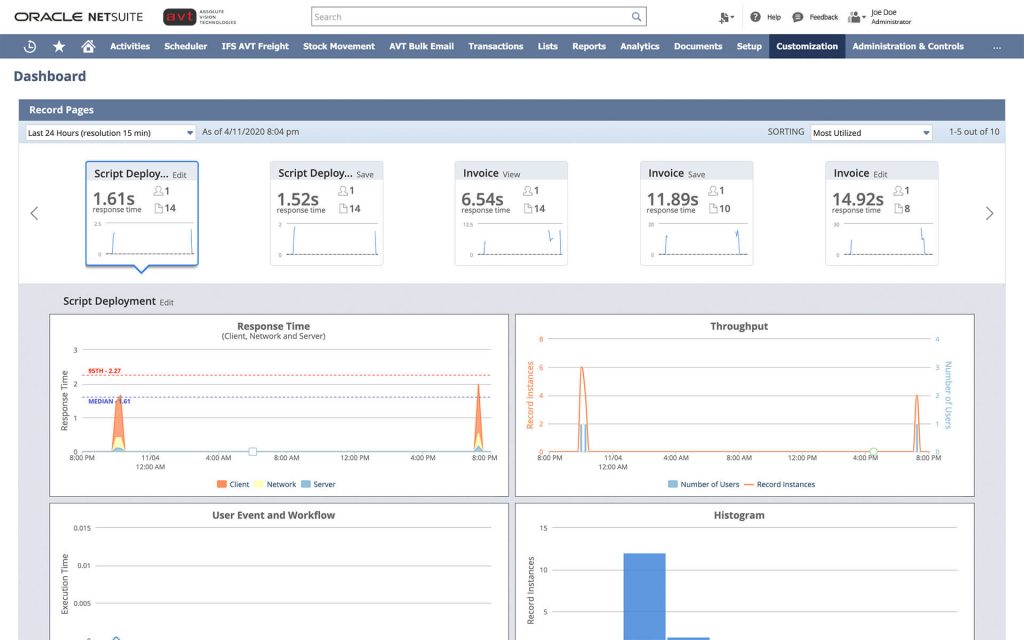
1. Dashboard Most Utilised: Record Pages Monitor lets you identify and troubleshoot the performance of your record pages. Visual indicators alert you to performance issues and anomalies, which you can investigate by using the portlets and quick links. By default, the dashboard displays the 10 most utilized record operations.
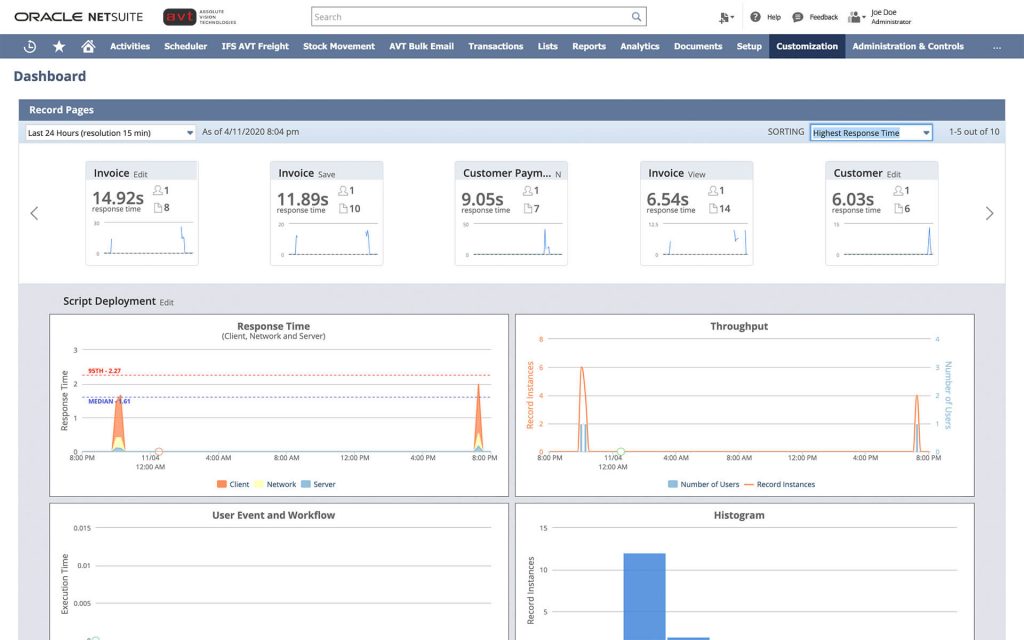
2. Dashboard High Response: Can view by highest Response time.
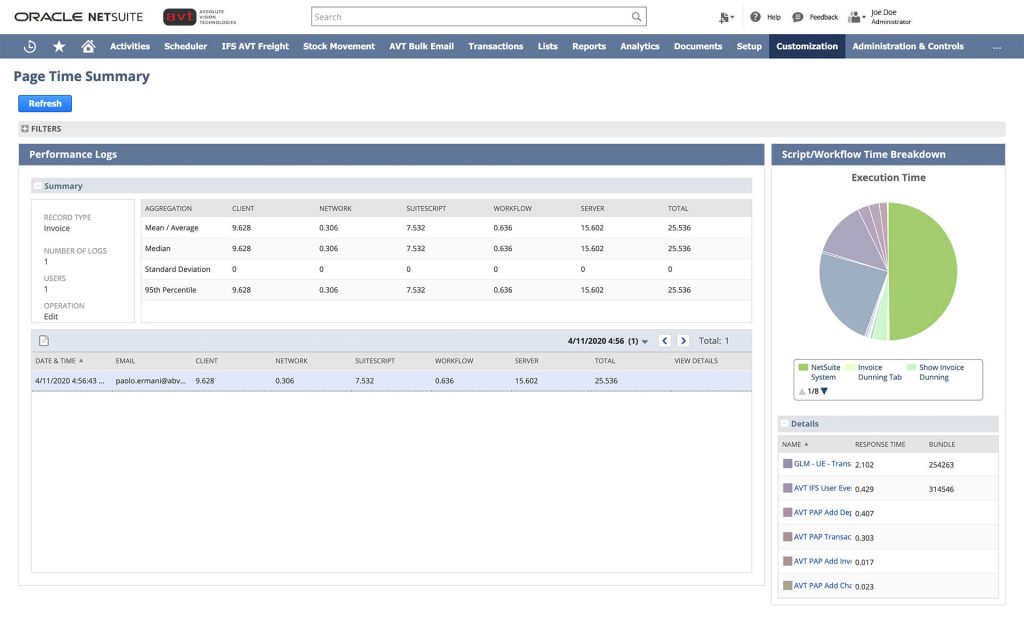
3.Page Summary: The Page Time Summary is a troubleshooting tool, which displays performance logs by record type. This page includes summary performance log information and a list of instances. It displays a script and workflow time breakdown chart for the actively selected instance.
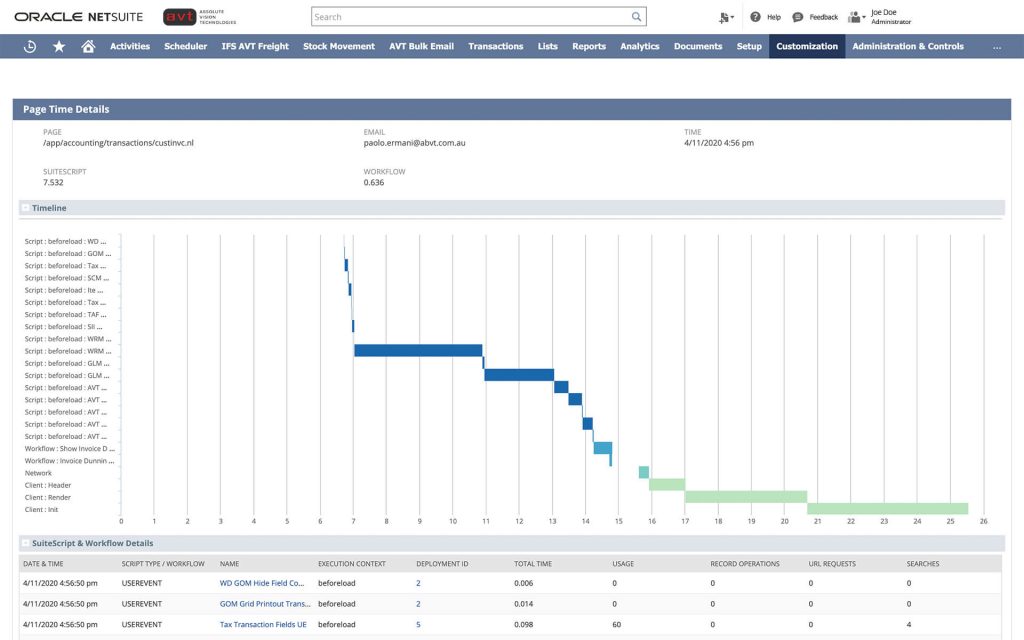
4. Page Summary Details: Page Time Details lets you view overview information about a specific operation during a specific date and time.
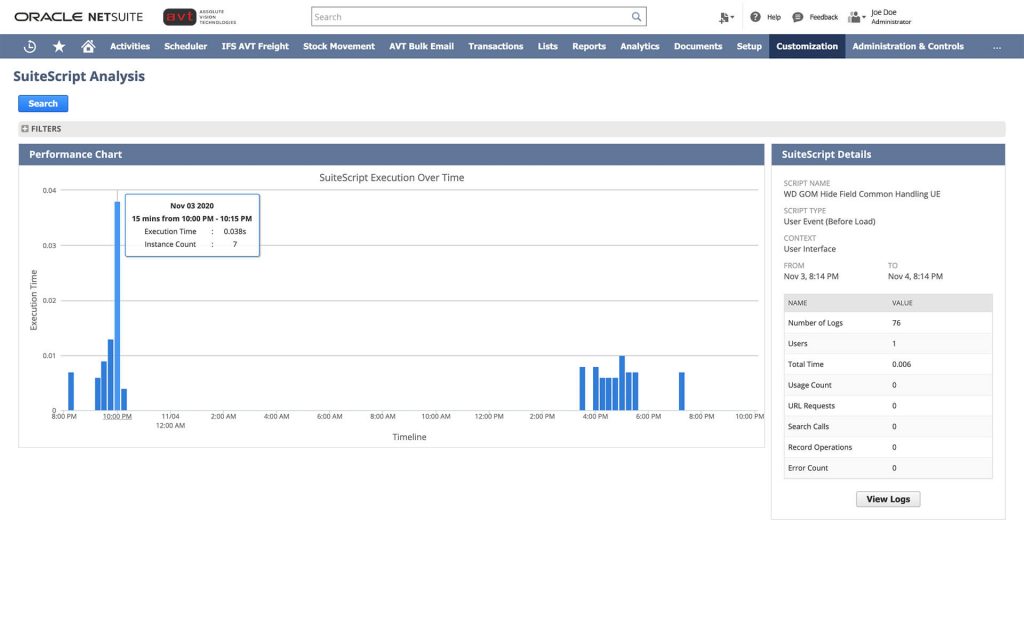
5. Script Analysis: SuiteScript Analysis to learn about when a script was installed and how it performed in the past.
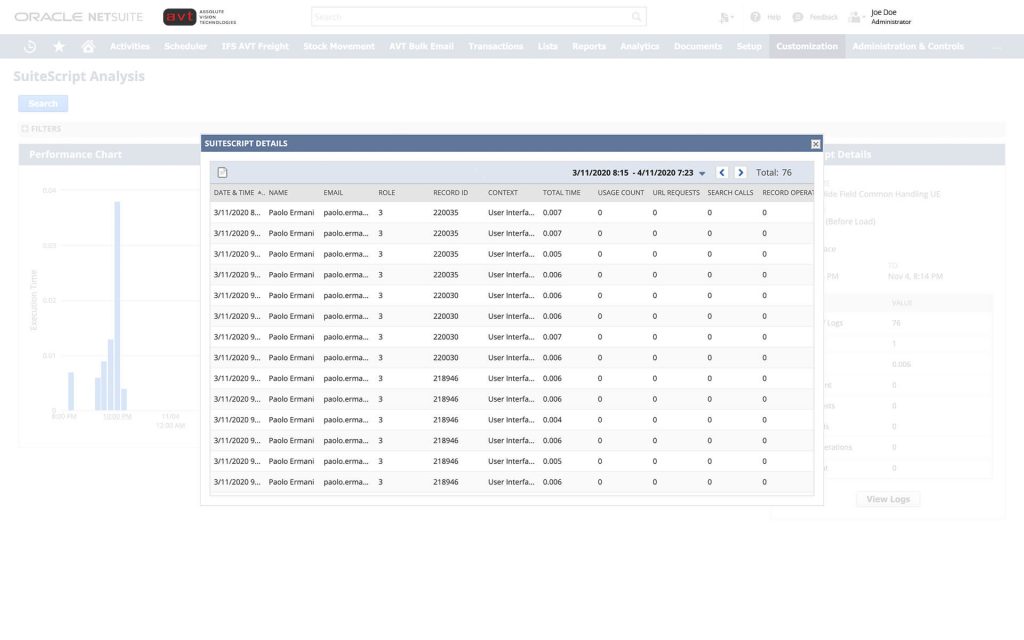
5.1 Script Analysis Detail Log: Detailed info on script execution
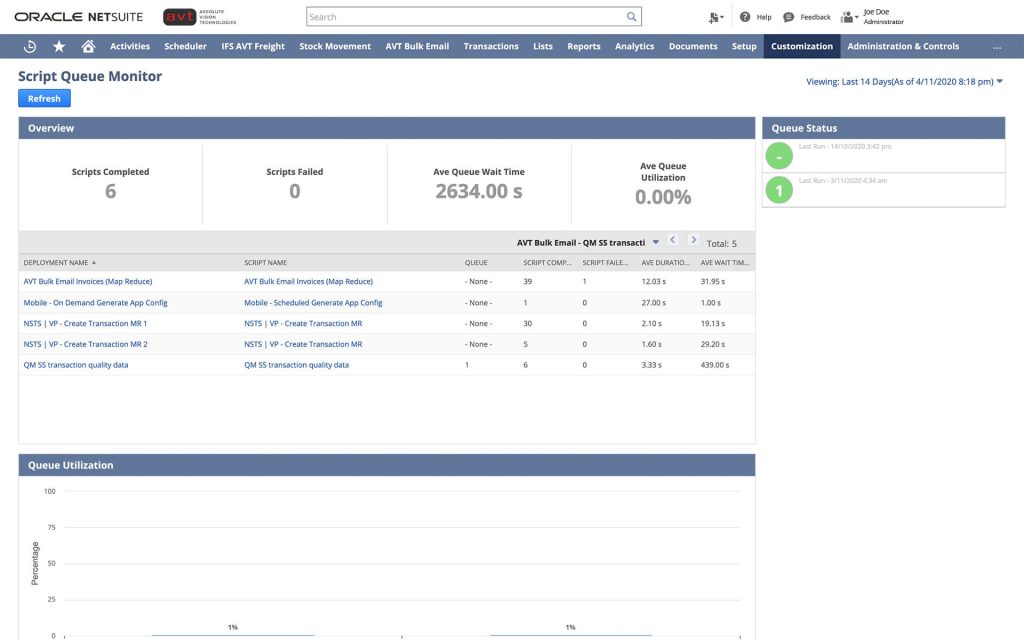
6. Script Queue Monitor: SuiteCloud Processors Monitor tool to view and analyze the performance of your map/reduce and scheduled script jobs handled by SuiteCloud Processors.
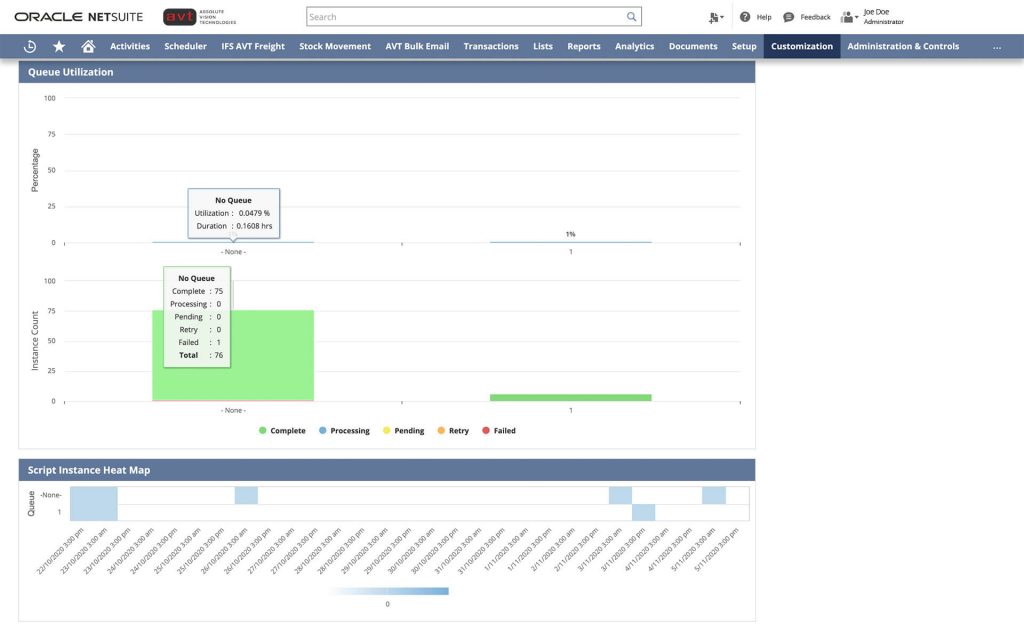
6.1 Script Utilisation SuiteCloud Processors Monitor tool to view and analyze the performance of your map/reduce and scheduled script jobs handled by SuiteCloud Processors.
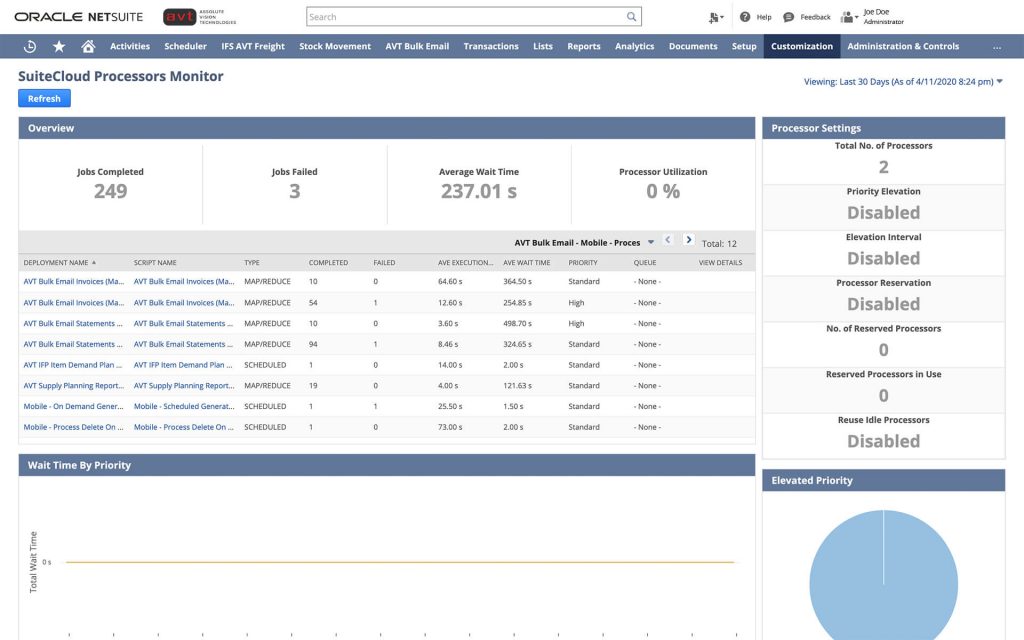
7. SuiteCloud Processor Monitor: Shows vital processor settings and statistics in several portlets, so you can compare data and improve your performance.
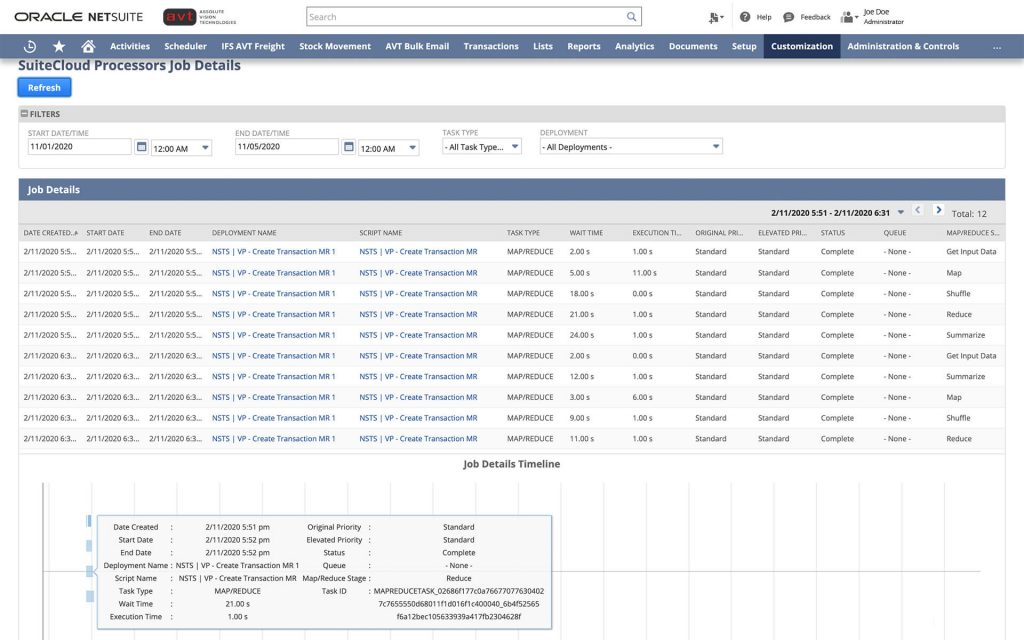
8. Suite Processor Job Details: Provides in-depth information about specific deployments based on your selected filters.
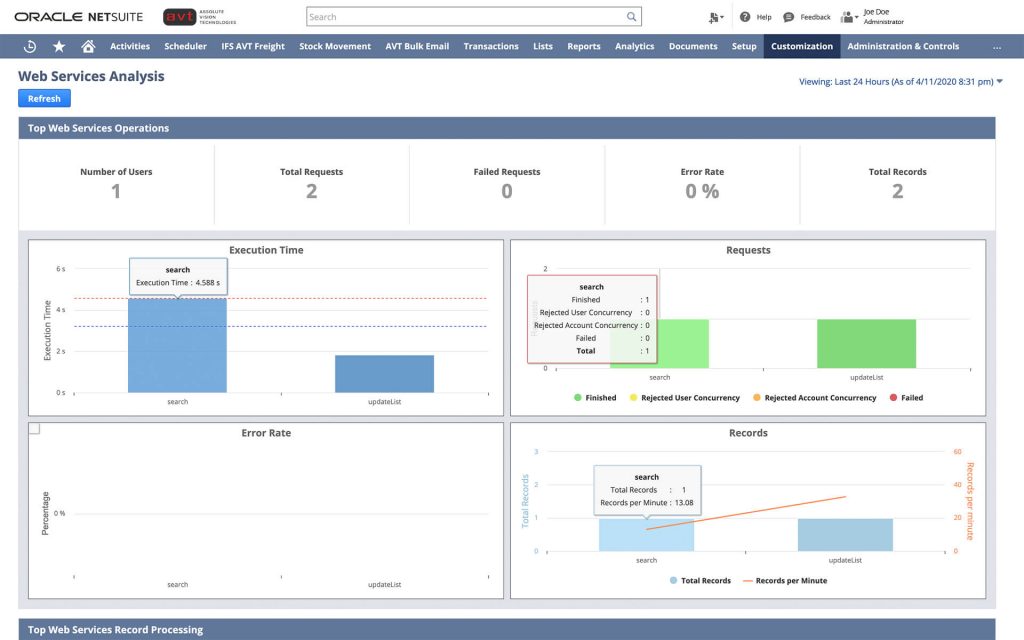
9. Webservice Analysis: Monitors the performance of your SOAP web services in real time.
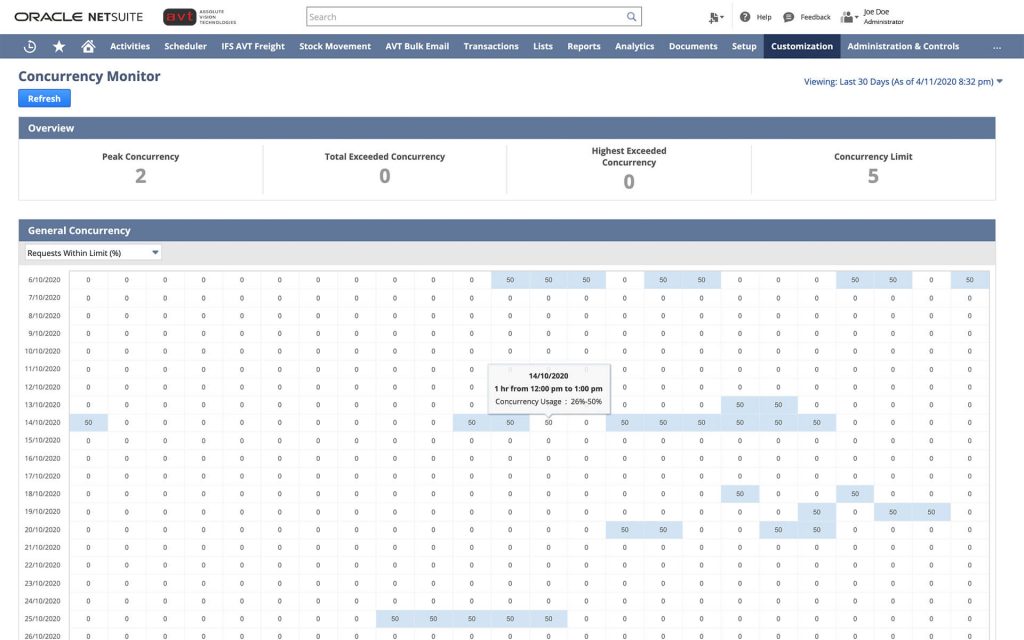
10. Concurrency Monitor: Concurrency Monitor tool is used to analyze the performance of web services and RESTlet integrations. The tool includes dashboards that lets you view critical data about your concurrent requests and limits.

10.1 Concurrency Monitor:This dashboard is used to view concurrency data across different date range selections.
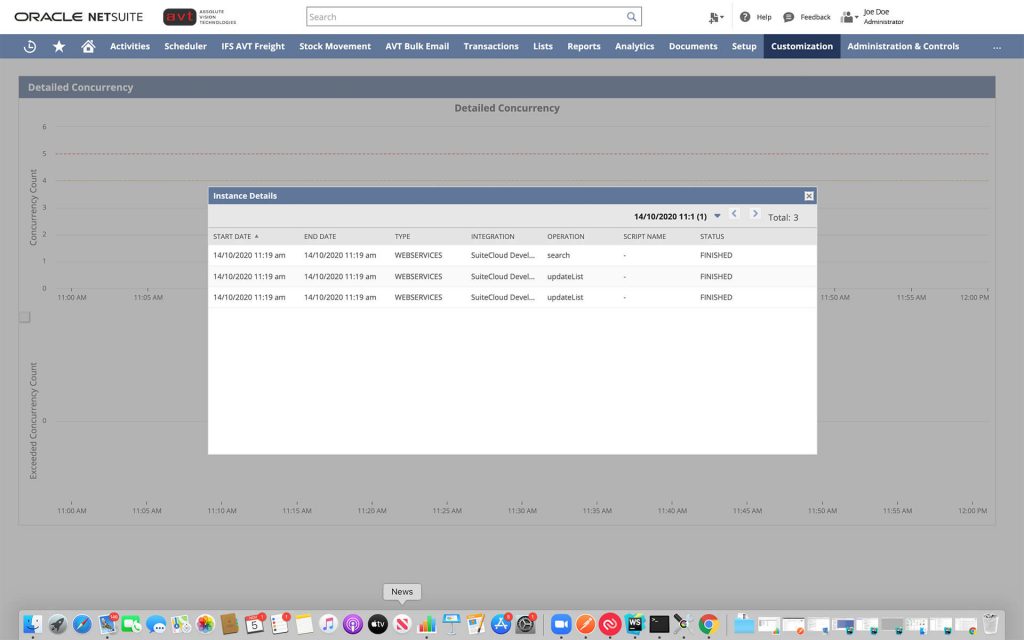
10.2 Concurrency Monitor: The dashboard displays data according to the governance type that applies to your account.
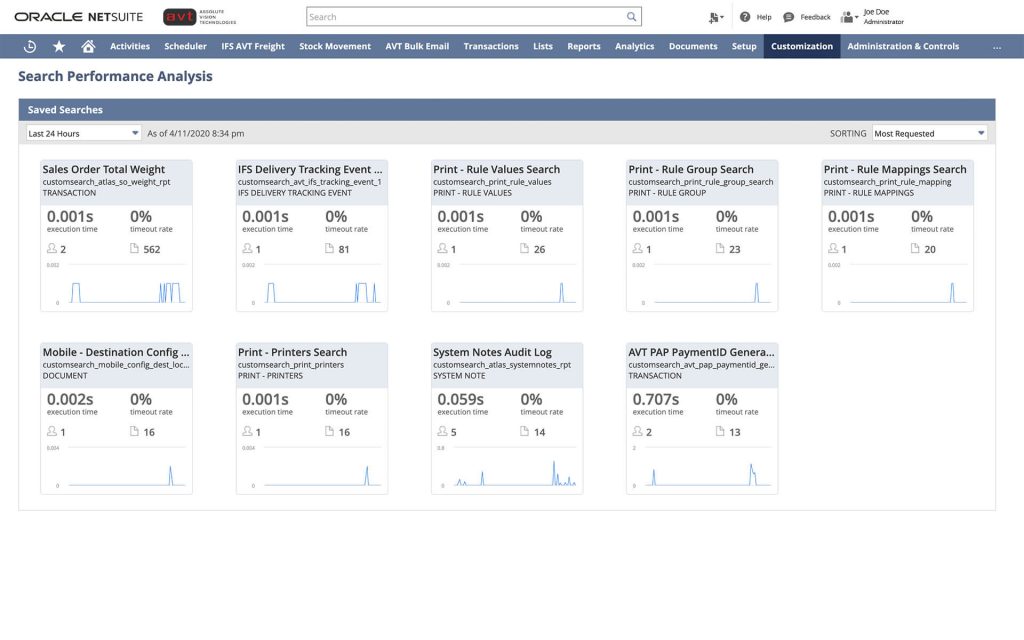
11 Search Most Requested: Search Analysis: Provides several tools for you to view and analyze the performance of your saved searches.
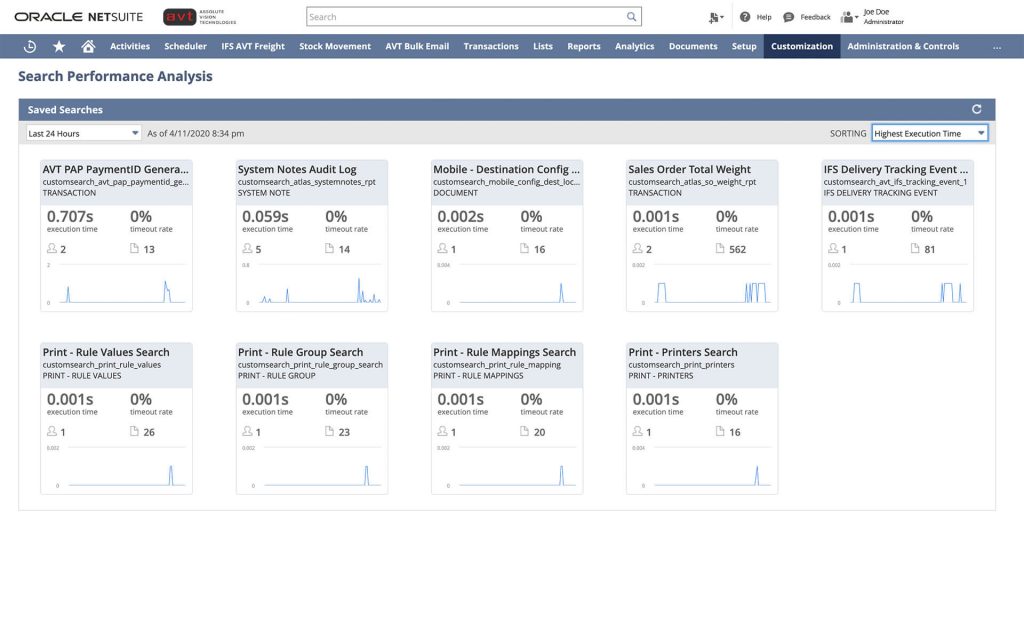
11.1 Search High Response: The dashboard presents saved searches in the form of tiles, which contains helpful metrics updated in real time.
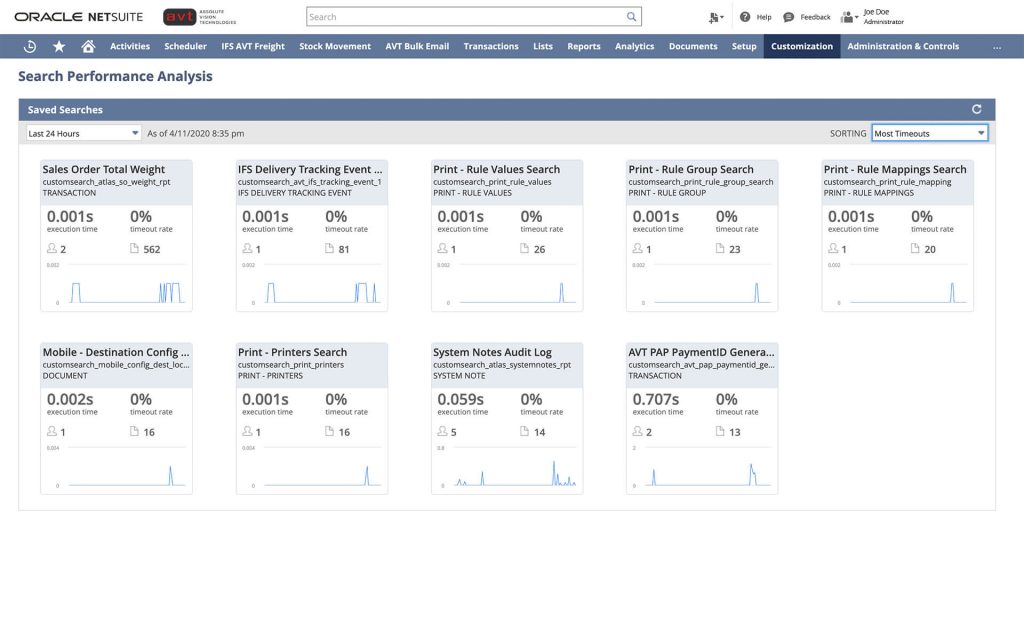
11.2 Search Most Timed Out: You can use this tool to quickly identify saved search performance issues and anomalies.
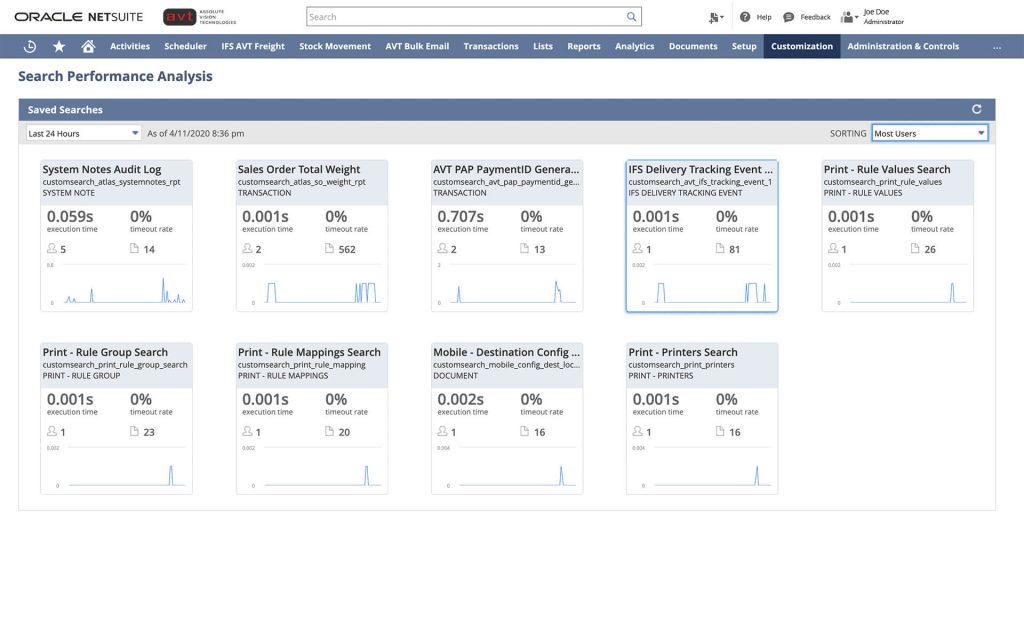
11.3 Search Most User: Looking at the dashboard also lets you promptly compare statistics between various saved searches.
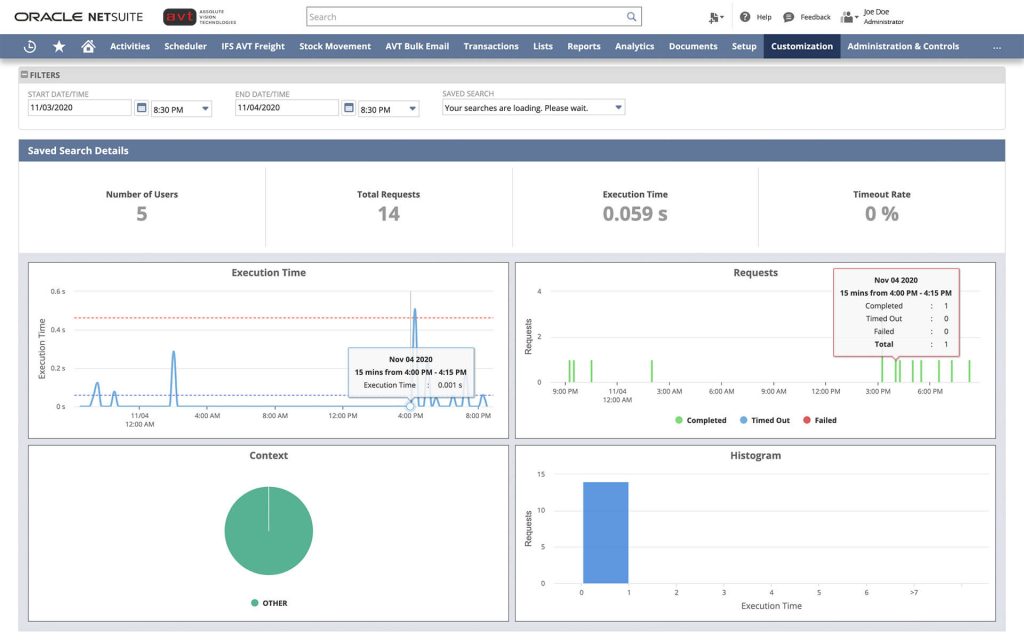
12. Search Details: The Search Performance Analysis dashboard is a visual tool for monitoring multiple saved searches on one page.
For more information on AVT NetSuite Application Performance ManagementSuiteApp, or for a Free Consultation, contact AVT today!
If you have any questions about sending emails from NetSuite or would like help in your organisation with NetSuite, please contact us at support@abvt.com.au.
Please also consider book-marking the AVT Support Services – your go-to resource to submit support tickets and access knowledge base articles. The AVT Support Services also contains a direct link to NetSuite’s system status page.
Kind regards,
AVT Business Solutions